
On March 28, 2011, FinCEN issued its Mortgage Loan Fraud Update (Report) for the period January 1, 2010 to December 31, 2010.
This update to FinCEN's prior Mortgage Loan Fraud (MLF) studies looks at Suspicious Activity Report (SAR) filings in CY 2010, with a particular emphasis on the 4th Quarter of CY 2010 (Q4). It provides new information on reporting activities, geographic locations, and other filing trends in Q4 and CY 2010.
As in previous updates, this update also includes tables and illustrations of various geographies that compare Q4 and CY 2010 filings based on the dates on which the suspicious activities are reported to have begun.
A review of the full year data shows the number of suspicious activity reports (SARs) involving mortgage loan fraud (MLF) increased 4 percent in 2010 to 70,472 compared with 67,507 MLF SARs filed in 2009.
The report also shows that the growth rate of MLF SARs began to slow over the last two to three years. Looking at just the 2010 fourth quarter, filers submitted 18,759 MLF SARs, a 1 percent decrease from the 18,884 filings over the same period in 2009.
FinCEN also reported that all types of SARs filed by depository institutions in 2010 fell 3 percent to 697,389 compared with 720,309 SARs filed by depository institutions in 2009.
However, the total number of SARs filed in 2010 by all types of financial institutions covered by the Bank Secrecy Act grew nearly 4 percent to 1.3 million SARs up from 1.9 million filed in 2009.
Trend
Since 2001, the number of MLF SARs filed has shown a consistent upward trend, albeit at a slower rate of growth in recent years.

Bankruptcy
The Report found that references to bankruptcy have steadily increased over time in MLF SAR filings. In 2010, 6 percent of all MLF SARs contained a key term related to bankruptcy in the SAR narrative, compared to 1 percent in 2006 and 2007.
In 2010, mortgage loan fraud was cited in 54 percent of all SARs referencing bankruptcy fraud, up from 42 percent in 2009. Some MLF SARs specified the type of bankruptcy filing, most frequently Chapter 7, which was cited in 27 percent of 2010 reports citing both bankruptcy and MLF.
Flopping
Flopping occurs when a foreclosed property is sold at an artificially low price to a straw buyer, who quickly sells the property at a higher price and pockets the difference. Anecdotal feedback on this practice from law enforcement and industry sources suggests that the volume of related MLF SARs is much lower than the actual number of suspected flopping incidents. The increasingly dated activities reported on SARs suggests a lack of emphasis on this type of current activity.
Filers in their SARs also called attention to debt elimination scams as one of the emerging practices.
Debt elimination scams were cited in nearly 1,300 MLF SARs in 2010. In these SARs, filers noted subjects sending a variety of documents or bogus payment methods to financial institutions, in attempts to eliminate or satisfy mortgage obligations. SAR filers over the course of 2010 explicitly referenced "flopping" in 112 SARs last year. This compares with relatively stable occurrences of suspicious activity involving broker price opinions and short sales in 2010.

5 Highest MSAs Per Capita - MLF SAR Filings
The Report contains data of state, county, and metropolitan statistical area (MSA) by total number of and per capita filings of MLF SARs.
Nevada had the highest number of MLF SARs per capita in 2010, followed by Florida, California, Illinois, and Georgia.
The 5 MSAs with the highest per capita filings of MLF SARs in 2010 were Miami; Las Vegas; San Jose, CA; Riverside, CA; and Los Angeles.
The 5 counties with the highest number of MLF SARs per capita were Miami-Dade, Gwinnett in Georgia, Broward and Orange in Florida, and Nassau in New York.
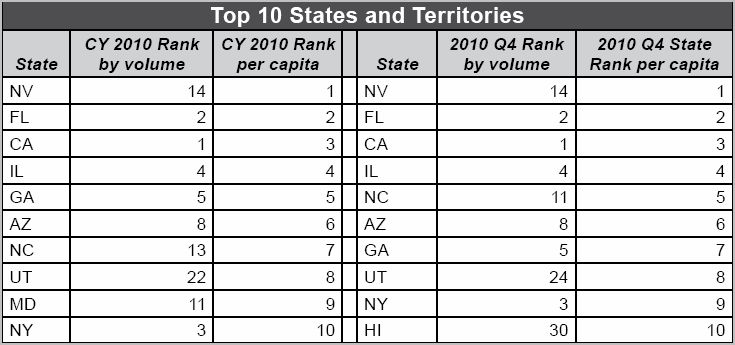
In both CY 2010 and 2010 Q4, California and Florida were the highest ranked states based on total numbers of subjects, followed by New York and Illinois. These four states consistently had the highest rankings every quarter of 2010.
For both the quarter and year, Nevada had the highest number of MLF subjects per capita, followed by Florida, California, and Illinois.
This was a change from 2010 Q3, when Florida was 1st in MLF subjects per capita and Nevada 3rd. In addition, Hawaii jumped in the Q4 rankings to 10th in MLF subjects per capita, up from 13th in Q3 and 26th in Q2.
"Other" Suspicious Activity
Nearly half of the filings involved debt elimination scams, while 13 percent included misrepresentation of income or employment.
Another 13 percent were for Social Security number misuse and 9 percent loan modification fraud.

Visit Library

FinCEN: Mortgage Loan Fraud Update
SARs from January 1, 2010 to December 31, 2010
Issued: March 28, 2011
SARs from January 1, 2010 to December 31, 2010
Issued: March 28, 2011